gocharts
GoCharts
![]()
![]()
![]()
![]()
![]()
GoCharts is a library to assist with building charts, by directly working with charting libraries, generating tabular data for Excel XLSX files and CSV files, or to transfer data to/from analytics solutions like Metabase and SimpleKPI.
Features
- 📊 Data Structures - Table, TimeSeries, Histogram, Roadmap, and more
- 📈 Multiple Chart Libraries - C3, D3, ECharts, Google Charts, Rickshaw, wchart
- 📗 Excel Integration - Read/write XLSX files with formatting
- 📝 Markdown Output - Generate tables for documentation
- 🔌 Analytics Integration - Metabase and SimpleKPI support
- 💻 Text Charts - Terminal-friendly progress bars and funnel charts
Contents
It includes two sets of packages:
- data structures to generically hold and manipulate different types of data
- chart library helpers to make generating charts easier, often times using data structures mentioned above
Data Structures
Commonly used data structures include:
- Table - easy manipulation of tabular data including writing to CSV and XLSX.
- Time Series - for building time-based line charts and bar charts.
- Histogram - for building histograms and bar charts.
A full list is available in the data folder.
Chart Helpers
- C3 - code, project
- D3 - code, project
- ECharts - code, project
- Google Charts - code, project
- Rickshaw - code, project
- go-analyze/charts - code, project
- Text Charts - code - Text-based progress bars and funnel charts
quicktemplate is used for rendering some of the charts.
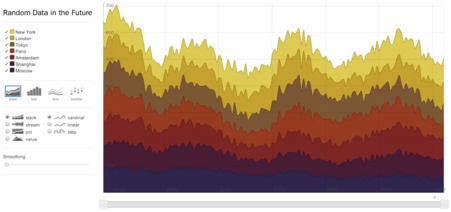
An example chart is the Rickshaw chart shown below:
Collections
Data collections are provided in the collections folder for the primary purpose of providing example data to run in the examples. Currently, cryptocurrency data from Yahoo! Finance is included.
Applications
Various helpers to use applications are located in the apps folder for the primary purpose of providing reusable and example code.
Installation
$ go get github.com/grokify/gocharts/v2/...
Quick Start
Creating a Histogram
import "github.com/grokify/gocharts/v2/data/histogram"

h := histogram.NewHistogram("Response Codes")
h.Add("200", 150)
h.Add("404", 25)
h.Add("500", 10)

// Output as Markdown table
md := h.Markdown()
Creating a Table and Exporting to XLSX
import "github.com/grokify/gocharts/v2/data/table"

tbl := table.NewTable("Sales Report")
tbl.Columns = []string{"Region", "Q1", "Q2", "Q3", "Q4"}
tbl.Rows = [][]string{
    {"North", "100", "120", "130", "150"},
    {"South", "90", "95", "100", "110"},
}

// Write to Excel
err := tbl.WriteXLSX("report.xlsx")
Converting Histogram to Google Charts DataTable
import (
    "github.com/grokify/gocharts/v2/data/histogram"
    "github.com/grokify/gocharts/v2/charts/google"
)

hs := histogram.NewHistogramSet("Traffic by Hour")
// ... populate histogram set ...

dt := google.DataTableFromHistogramSet(hs)
Output Formats
GoCharts supports multiple output formats:
| Format | Package | Description |
|---|---|---|
| CSV | data/table |
Comma-separated values |
| XLSX | data/table |
Excel spreadsheets via excelize |
| Markdown | data/histogram |
GitHub-flavored markdown tables |
| HTML | charts/* |
Chart library-specific HTML via quicktemplate |
| ASCII | data/table |
Terminal-friendly tables via tablewriter |
Examples
Examples are available in each chart package’s examples/ directory:
| Chart Library | Example Location |
|---|---|
| Google Charts | charts/google/examples/ |
| wchart | charts/wchart/examples/ |
| C3 | charts/c3/examples/ |
| Rickshaw | charts/rickshaw/examples/ |
| D3 Bullet | charts/d3/d3bullet/examples/ |
## Mentions